
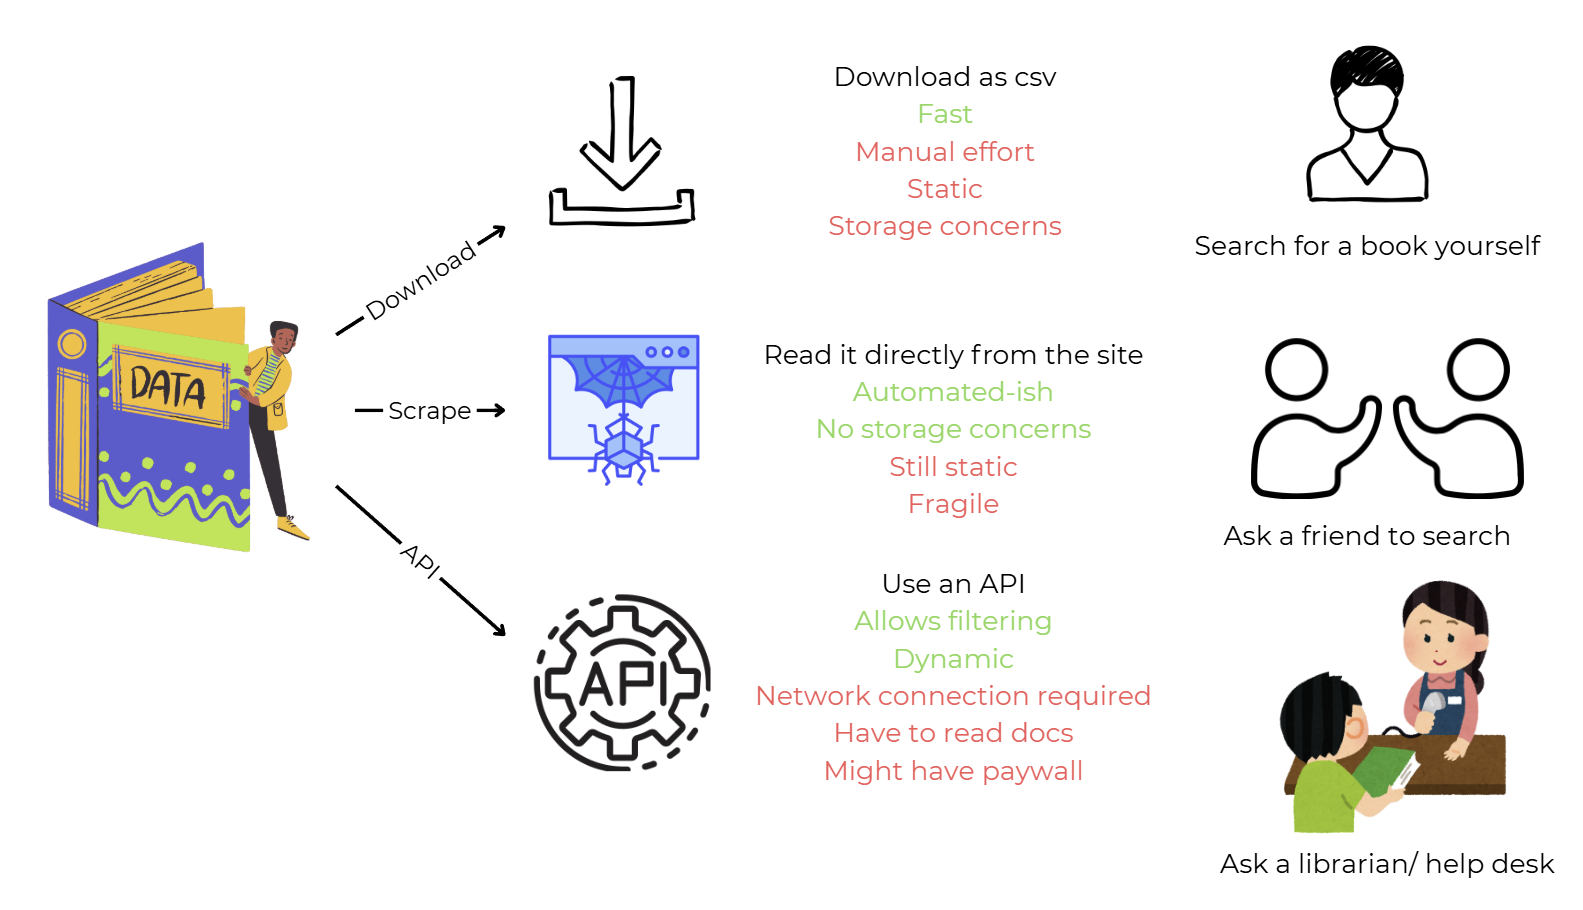
Task
Pull Wikipedia’s list of countries by area into a DataFrame using read_html().
Notes
Refresher: HTML
Websites are built with HTML (HyperText Markup Language).
pandas.read_html()works by scanning the page’s HTML for table elements and converting them into DataFrames.
APIs
In the context of APIs, a request is a message your code sends to a server asking for data (usually in the format of HTML, JSON, etc.).
The server replies with a response, which contains the actual data (and a status code).
Try
read_html()directly with the URLRun
pd.read_html("https://en.wikipedia.org/wiki/List_of_countries_and_dependencies_by_area"). Does this work? Why not? What does the error tell you?This means the server blocked your request, often because pandas doesn’t include browser-like headers, so Wikipedia thinks this is an automated script it should reject.
Use
requestsinsteadWhen we manually use
requests.get(), we can mimic a real browser by adding headers (likeUser-Agent).The server then returns the full HTML as the response — and that HTML can be fed into
pd.read_html().
Hints
Use “Inspect” in the Developer Tools to examine the website. See class notes here that have tips for different browsers.
Check “Network” traffic & headers to set up your request. Open Inspect → Network, reload the page. When you see an API request, click on it, and then view the “Headers.” Find the
User-Agentyour browser sends. You can copy this into yourrequests.get()call to make Wikipedia accept your script.
# your code herePart 2: Time Series
Task
Using MTA ridership data, view the bus ridership over time. Start with per day, then do per week.
Notes
Refresher: Datetime
Dates and times in Python are usually handled with
datetimeobjects, which store time information in a structured, numerical format instead of plain text. Libraries likepandascan parse strings like “2021-04-01” into real datetime objects.Once converted, you can sort, filter, resample (daily/weekly/monthly), and perform calculations on them — operations that wouldn’t work reliably on raw text.
Feel free to either download the CSV directly, or use an API call to retrieve the data.
Hints
You will need to clean the data! This includes general cleaning, as well as converting to appropriate types (e.g. datetimes).
Recall different ways to resample:
.size()vs..sum(). What is the difference between them? Which function should you use in this case?
# Read data from MTA ridership dataset
# your code here


# Clean columns as needed
# your code here


# Convert date column to datetime
# your code here


# Plot bus ridership per day
# your code here


# Resample data to get bus ridership per week
# your code here


# Plot bus ridership per week
# your code here
Part 3: API & Pagination
Task
You’re going to pick a World Bank Indicator and plot that over time. You’ll retrieve the data through the API.
Task 3a
For this part, only use data from the first “page” of results.
Notes
Reading API documentation is ESSENTIAL!
Documentation helps you understand what kinds of data is available, and what format it will be in.
See here for World Bank API documentation.
Hints
Start simple
Use the Python requests package
See
json_normalize()Use the “Page” and “Output Format” parameters in the API documentation.
# Send request to World Bank API
# your code here

# Read / format the response
# your code here

# Clean as needed
# your code here

# Plot the indicator over time
# your code here
Task 3b: Pagination
See Lecture 23. Restriction for this lab: Page size shouldn’t be set greater than 1000.
Hints
You’ll want to create DataFrames for each page, then “concatenate” them. See below for a general structure you can start with.
# in a loop
#     get the first/next page of data
#     combine with the data that's already been retrieved
#     if there are fewer than the default number of records returned, stop the loop


# your code here