
import plotly.io as pio

pio.renderers.default = "notebook_connected+plotly_mimetype"
Dates and time series analysis
From Wikipedia:
A time series is a series of data points indexed (or listed or graphed) in time order. Most commonly, a time series is a sequence taken at successive equally spaced points in time. Thus it is a sequence of discrete-time data.
What are time series you’ve seen / worked with?
Importing necessary packages
import pandas as pd
import plotly.express as px
<frozen importlib._bootstrap>:491: RuntimeWarning:
The global interpreter lock (GIL) has been enabled to load module 'pandas._libs.pandas_parser', which has not declared that it can run safely without the GIL. To override this behavior and keep the GIL disabled (at your own risk), run with PYTHON_GIL=0 or -Xgil=0.
Data preparation
Load 311 data.
requests_311 = pd.read_csv("https://storage.googleapis.com/python-public-policy2/data/311_requests_2018-19_sample_clean.csv.zip")/var/folders/kr/nx0m1j811kz5vy8c87ffchzr0000gn/T/ipykernel_93083/99667367.py:1: DtypeWarning:
Columns (8,20,31,34) have mixed types. Specify dtype option on import or set low_memory=False.
requests_311[["Created Date", "Closed Date"]]The dates are strings:
requests_311.dtypesUnique Key int64
Created Date object
Closed Date object
Agency object
Agency Name object
Complaint Type object
Descriptor object
Location Type object
Incident Zip object
Incident Address object
Street Name object
Cross Street 1 object
Cross Street 2 object
Intersection Street 1 object
Intersection Street 2 object
Address Type object
City object
Landmark object
Facility Type object
Status object
Due Date object
Resolution Description object
Resolution Action Updated Date object
Community Board object
BBL float64
Borough object
X Coordinate (State Plane) float64
Y Coordinate (State Plane) float64
Open Data Channel Type object
Park Facility Name object
Park Borough object
Vehicle Type object
Taxi Company Borough object
Taxi Pick Up Location object
Bridge Highway Name object
Bridge Highway Direction object
Road Ramp object
Bridge Highway Segment object
Latitude float64
Longitude float64
Location object
dtype: objectConvert columns to timestamps using pandas’ to_datetime()
requests_311["Created Date"] = pd.to_datetime(requests_311["Created Date"], format="%m/%d/%Y %I:%M:%S %p")
requests_311["Closed Date"] = pd.to_datetime(requests_311["Closed Date"], format="%m/%d/%Y %I:%M:%S %p")
requests_311[["Created Date", "Closed Date"]]More about the format string. If you don’t provide one, it will take much longer to convert.
Check data types and confirm they are now datetime:
requests_311.dtypesUnique Key int64
Created Date datetime64[ns]
Closed Date datetime64[ns]
Agency object
Agency Name object
Complaint Type object
Descriptor object
Location Type object
Incident Zip object
Incident Address object
Street Name object
Cross Street 1 object
Cross Street 2 object
Intersection Street 1 object
Intersection Street 2 object
Address Type object
City object
Landmark object
Facility Type object
Status object
Due Date object
Resolution Description object
Resolution Action Updated Date object
Community Board object
BBL float64
Borough object
X Coordinate (State Plane) float64
Y Coordinate (State Plane) float64
Open Data Channel Type object
Park Facility Name object
Park Borough object
Vehicle Type object
Taxi Company Borough object
Taxi Pick Up Location object
Bridge Highway Name object
Bridge Highway Direction object
Road Ramp object
Bridge Highway Segment object
Latitude float64
Longitude float64
Location object
dtype: objectNoise complaints per day
noise = requests_311[requests_311["Complaint Type"] == "Noise - Residential"]
noise_per_day = noise.resample("D", on="Created Date").size().reset_index(name="count_requests")

noise_per_dayResampling
Once you have a column with datetime objects, pandas can manipulate them directly. From the User Guide:
resample()is a time-basedgroupby
.resample('D', on='Created Date')The 'D' is the period alias, i.e. the desired frequency.
fig = px.line(
    noise_per_day,
    x="Created Date",
    y="count_requests",
    title="Noise complaints per day",
)
fig.show()Let’s try weekly:
noise_per_week = noise.resample("W", on="Created Date").size().reset_index(name="count_requests")

fig = px.line(
    noise_per_week,
    x="Created Date",
    y="count_requests",
    title="Noise complaints per week",
)
fig.show()What’s the average duration?
# calculate the amount of time that passed between Created Date and Closed Date

requests_311["resolution_duration"] = requests_311["Closed Date"] - requests_311["Created Date"]

# print head to check results

requests_311[["Closed Date", "Created Date", "resolution_duration"]].head()requests_311.dtypesUnique Key int64
Created Date datetime64[ns]
Closed Date datetime64[ns]
Agency object
Agency Name object
Complaint Type object
Descriptor object
Location Type object
Incident Zip object
Incident Address object
Street Name object
Cross Street 1 object
Cross Street 2 object
Intersection Street 1 object
Intersection Street 2 object
Address Type object
City object
Landmark object
Facility Type object
Status object
Due Date object
Resolution Description object
Resolution Action Updated Date object
Community Board object
BBL float64
Borough object
X Coordinate (State Plane) float64
Y Coordinate (State Plane) float64
Open Data Channel Type object
Park Facility Name object
Park Borough object
Vehicle Type object
Taxi Company Borough object
Taxi Pick Up Location object
Bridge Highway Name object
Bridge Highway Direction object
Road Ramp object
Bridge Highway Segment object
Latitude float64
Longitude float64
Location object
resolution_duration timedelta64[ns]
dtype: objectrequests_311["resolution_duration"].mean()Timedelta('7 days 22:46:26.962985676')requests_311["resolution_duration"].median()Timedelta('1 days 05:19:58')Filtering timestamps
Noise complaints over New Year’s.
requests_311after_dec_31 = requests_311["Created Date"] >= pd.Timestamp(2018, 12, 31)
before_jan_2 = requests_311["Created Date"] < pd.Timestamp(2019, 1, 2)
residential_only = requests_311["Complaint Type"] == "Noise - Residential"
condition = after_dec_31 & before_jan_2 & residential_only
new_years_noise = requests_311[condition]
display_columns = ["Created Date", "Complaint Type"]
new_years_noise[display_columns]You can also filter dates using strings, but using the Timestamp class is safer.
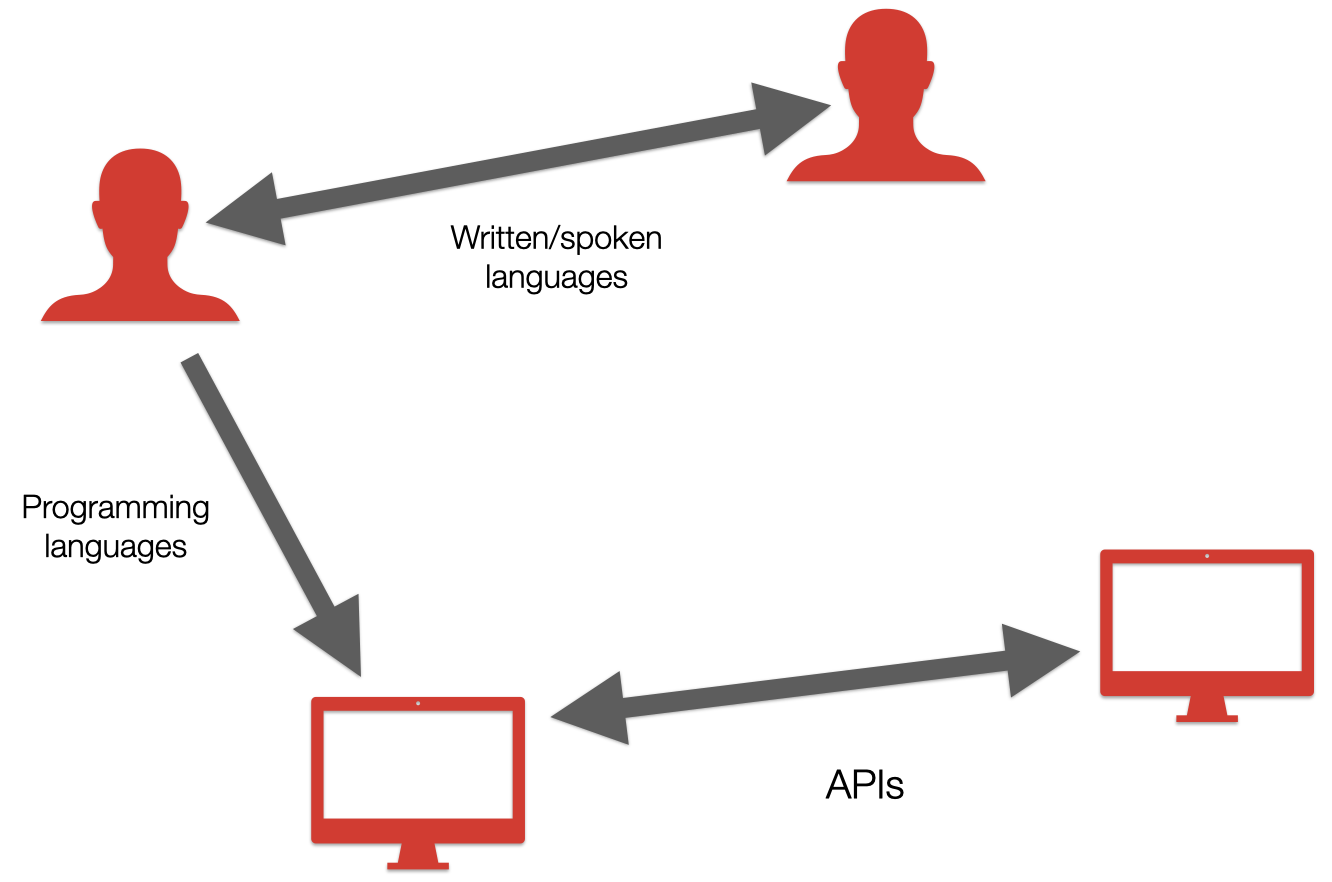
APIs
They are very powerful
Can be used from any programming language
APIs, conceptually
How does booking a flight work?
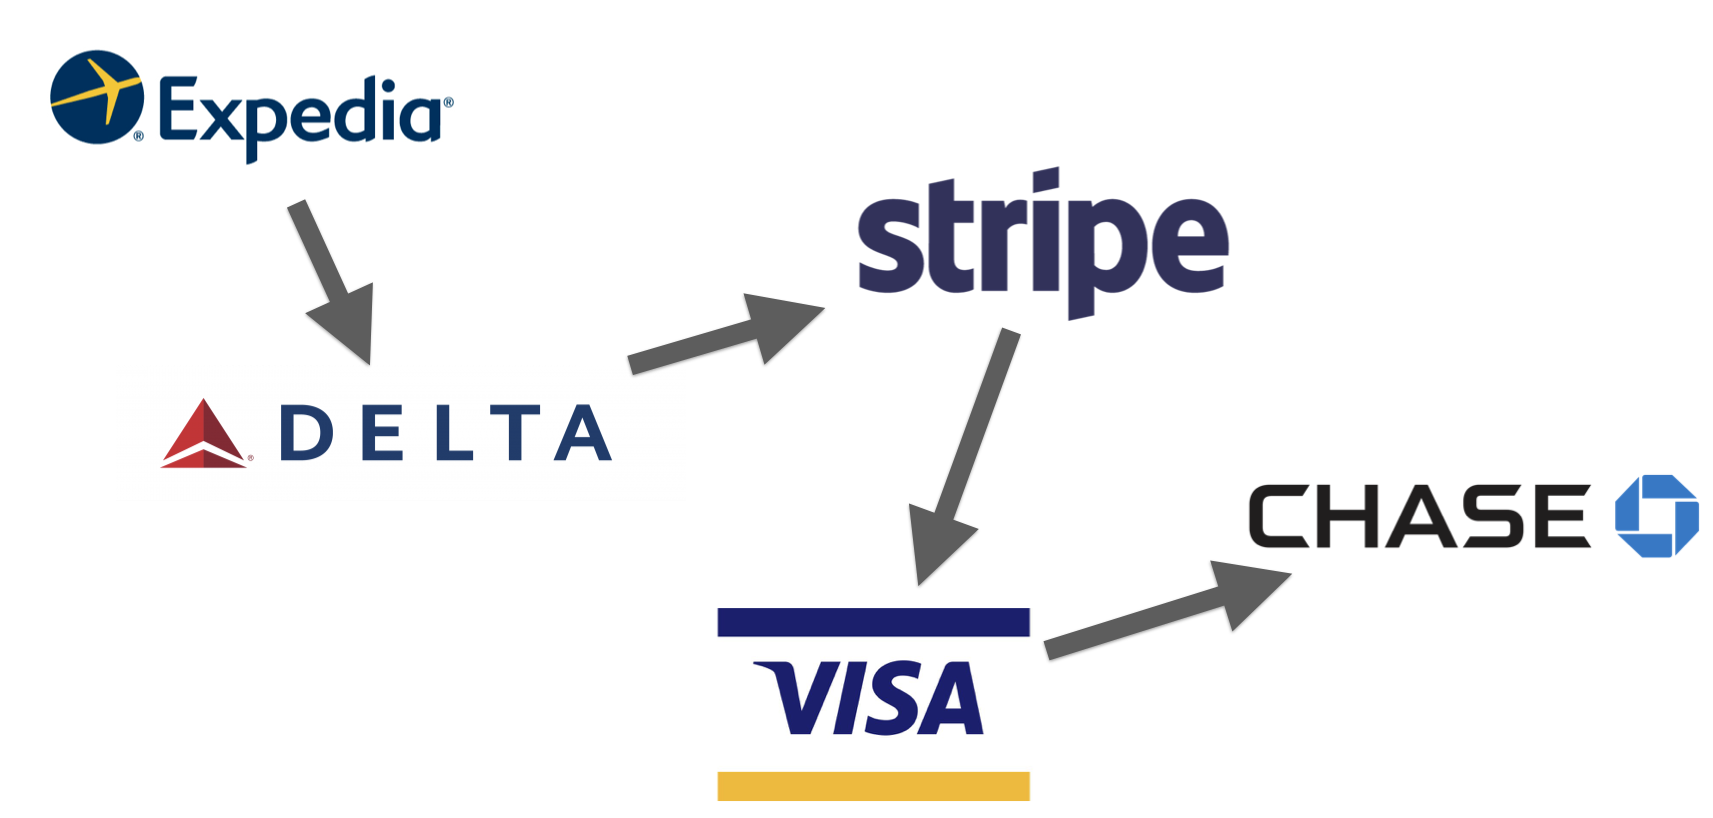
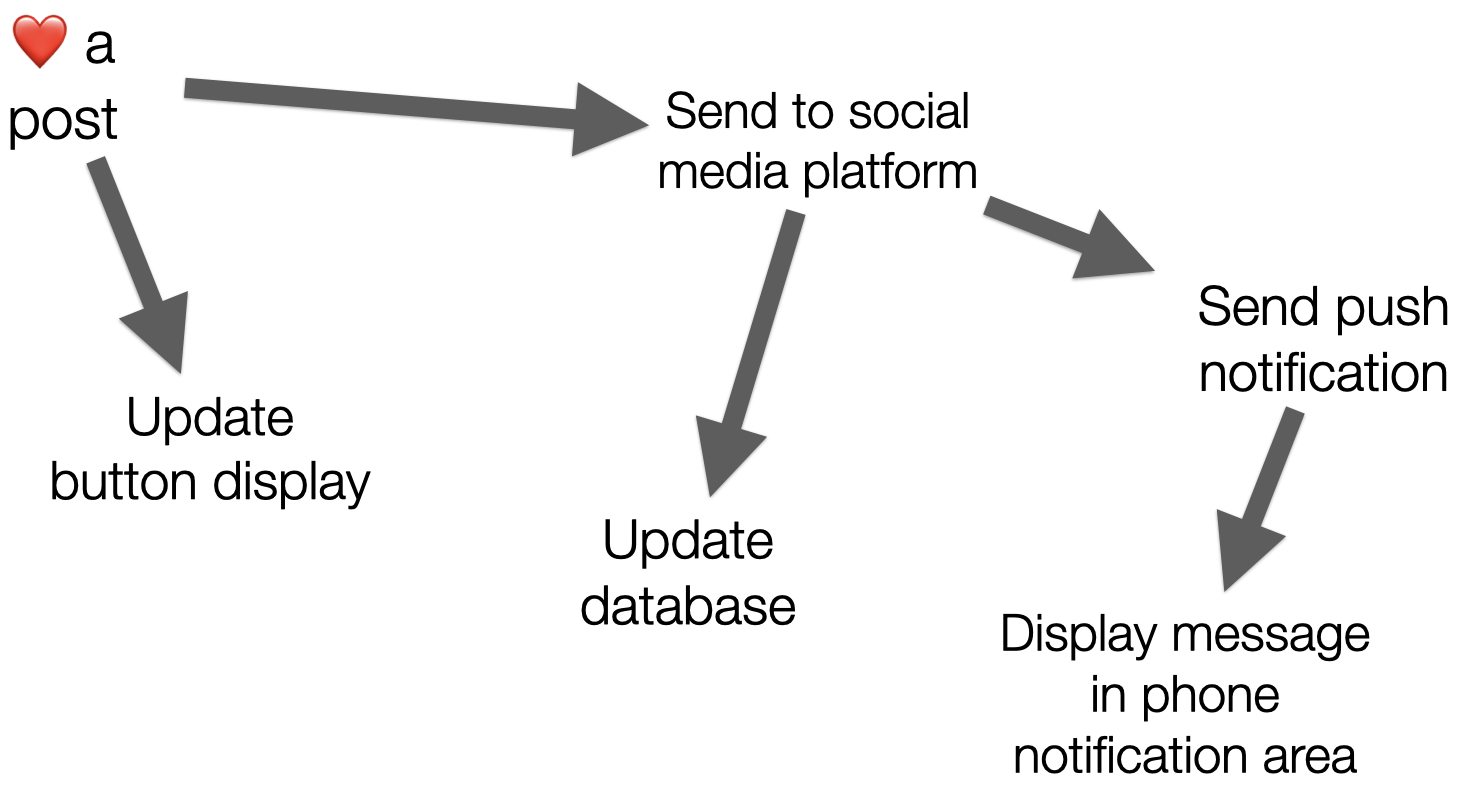
interactions between systems ↔️
Ways to get data
| Method | How it happens | Pros | Cons |
|---|---|---|---|
| Bulk | Download, someone hands you a flash drive, etc. | Fast, one-time transfer | Can be large; data gets out of date easily |
| APIs | If organization makes one available | Usually allows some filtering; can always pull latest-and-greatest | Requires network connection for every call; higher barrier to entry (reading documentation, access); subject to availability and performance of API |
| Scraping | Data only available through a web site, PDF, or doc | You can turn anything into data | Tedious; fragile |
Data is only available if it’s available
Please pray to the Demo Gods that these all work and there’s no profanity
API calls in the wild
Go to Candidates page on fec.gov.
Right click and
Inspect.Go to the
Networktab and reload.Filter to
XHR.Click the API call.
We only see this because the tables on fec.gov are rendered client-side using their JSON API. That won’t be the case for all tables on all sites.

For APIs:
Often split into “base URL” + “endpoint”
Endpoints are like function names: they represent the information you are retrieving or thing you are trying to do
Parameters are like function arguments:
They allow options to be specified
Some are required, some are optional
They will differ from one endpoint/function to another
Anchors won’t be used
Go to Population By Borough dataset and get the API endpoint.
API calls from Python
Usually one of two ways:
A software development kit (SDK) like sodapy
Abstracts the details away
Not available for all APIs
May have limitations
Nothing to do with 311 requests
import requests

response = requests.get("https://data.cityofnewyork.us/resource/xywu-7bv9.json")
data = response.json()

data
[{'age_group': 'Total Population',
'borough': 'NYC Total',
'_1950': '7891957',
'_1950_boro_share_of_nyc_total': '100.00',
'_1960': '7781984',
'_1960_boro_share_of_nyc_total': '100.00',
'_1970': '7894862',
'_1970_boro_share_of_nyc_total': '100.00',
'_1980': '7071639',
'_1980_boro_share_of_nyc_total': '100.00',
'_1990': '7322564',
'_1990_boro_share_of_nyc_total': '100.00',
'_2000': '8008278',
'_2000_boro_share_of_nyc_total': '100.00',
'_2010': '8242624',
'_2010_boro_share_of_nyc_total': '100.00',
'_2020': '8550971',
'_2020_boro_share_of_nyc_total': '100.00',
'_2030': '8821027',
'_2030_boro_share_of_nyc_total': '100.00',
'_2040': '9025145',
'_2040_boro_share_of_nyc_total': '100.00'},
{'age_group': 'Total Population',
'borough': ' Bronx',
'_1950': '1451277',
'_1950_boro_share_of_nyc_total': '18.39',
'_1960': '1424815',
'_1960_boro_share_of_nyc_total': '18.31',
'_1970': '1471701',
'_1970_boro_share_of_nyc_total': '18.64',
'_1980': '1168972',
'_1980_boro_share_of_nyc_total': '16.53',
'_1990': '1203789',
'_1990_boro_share_of_nyc_total': '16.44',
'_2000': '1332650',
'_2000_boro_share_of_nyc_total': '16.64',
'_2010': '1385108',
'_2010_boro_share_of_nyc_total': '16.80',
'_2020': '1446788',
'_2020_boro_share_of_nyc_total': '16.92',
'_2030': '1518998',
'_2030_boro_share_of_nyc_total': '17.22',
'_2040': '1579245',
'_2040_boro_share_of_nyc_total': '17.50'},
{'age_group': 'Total Population',
'borough': ' Brooklyn',
'_1950': '2738175',
'_1950_boro_share_of_nyc_total': '34.70',
'_1960': '2627319',
'_1960_boro_share_of_nyc_total': '33.76',
'_1970': '2602012',
'_1970_boro_share_of_nyc_total': '32.96',
'_1980': '2230936',
'_1980_boro_share_of_nyc_total': '31.55',
'_1990': '2300664',
'_1990_boro_share_of_nyc_total': '31.42',
'_2000': '2465326',
'_2000_boro_share_of_nyc_total': '30.78',
'_2010': '2552911',
'_2010_boro_share_of_nyc_total': '30.97',
'_2020': '2648452',
'_2020_boro_share_of_nyc_total': '30.97',
'_2030': '2754009',
'_2030_boro_share_of_nyc_total': '31.22',
'_2040': '2840525',
'_2040_boro_share_of_nyc_total': '31.47'},
{'age_group': 'Total Population',
'borough': ' Manhattan',
'_1950': '1960101',
'_1950_boro_share_of_nyc_total': '24.84',
'_1960': '1698281',
'_1960_boro_share_of_nyc_total': '21.82',
'_1970': '1539233',
'_1970_boro_share_of_nyc_total': '19.50',
'_1980': '1428285',
'_1980_boro_share_of_nyc_total': '20.20',
'_1990': '1487536',
'_1990_boro_share_of_nyc_total': '20.31',
'_2000': '1537195',
'_2000_boro_share_of_nyc_total': '19.20',
'_2010': '1585873',
'_2010_boro_share_of_nyc_total': '19.24',
'_2020': '1638281',
'_2020_boro_share_of_nyc_total': '19.16',
'_2030': '1676720',
'_2030_boro_share_of_nyc_total': '19.01',
'_2040': '1691617',
'_2040_boro_share_of_nyc_total': '18.74'},
{'age_group': 'Total Population',
'borough': ' Queens',
'_1950': '1550849',
'_1950_boro_share_of_nyc_total': '19.65',
'_1960': '1809578',
'_1960_boro_share_of_nyc_total': '23.25',
'_1970': '1986473',
'_1970_boro_share_of_nyc_total': '25.16',
'_1980': '1891325',
'_1980_boro_share_of_nyc_total': '26.75',
'_1990': '1951598',
'_1990_boro_share_of_nyc_total': '26.65',
'_2000': '2229379',
'_2000_boro_share_of_nyc_total': '27.84',
'_2010': '2250002',
'_2010_boro_share_of_nyc_total': '27.30',
'_2020': '2330295',
'_2020_boro_share_of_nyc_total': '27.25',
'_2030': '2373551',
'_2030_boro_share_of_nyc_total': '26.91',
'_2040': '2412649',
'_2040_boro_share_of_nyc_total': '26.73'},
{'age_group': 'Total Population',
'borough': ' Staten Island',
'_1950': '191555',
'_1950_boro_share_of_nyc_total': '2.43',
'_1960': '221991',
'_1960_boro_share_of_nyc_total': '2.85',
'_1970': '295443',
'_1970_boro_share_of_nyc_total': '3.74',
'_1980': '352121',
'_1980_boro_share_of_nyc_total': '4.98',
'_1990': '378977',
'_1990_boro_share_of_nyc_total': '5.18',
'_2000': '443728',
'_2000_boro_share_of_nyc_total': '5.54',
'_2010': '468730',
'_2010_boro_share_of_nyc_total': '5.69',
'_2020': '487155',
'_2020_boro_share_of_nyc_total': '5.70',
'_2030': '497749',
'_2030_boro_share_of_nyc_total': '5.64',
'_2040': '501109',
'_2040_boro_share_of_nyc_total': '5.55'}]Reading into a DataFrame
pd.DataFrame(data)Most open data sites have APIs
Often built on platforms that provide them, e.g.
NYC Open Data Portal built on ~~Socrata~~ Tyler Data & Insights
Their API is still called the Socrata Open Data API (SODA)
Pagination
Most APIs limit the number of results returned at once. Why would they do this?
You’ll work with this in Lab 12.
Things are going to differ by API
Endpoints
Supported parameters
Response structure
json_normalize()can help
Quality of documentation
Helpfulness of errors
Size/helpfulness of community
Gotta read and experiment.