
Spreadsheets vs. programming languages
What do you like about spreadsheets?
Why spreadsheets
The easy stuff is easy
Lots of people know how to use them
Mostly just have to point, click, and scroll
Data and logic live together as one
Why programming languages
Data and logic don’t live together
Why might this matter?
More powerful, flexible, and expressive than spreadsheet formulas; don’t have to cram into a single line
=SUM(INDEX(C3:E9,MATCH(B13,C3:C9,0),MATCH(B14,C3:E3,0)))Better at working with large data
Google Sheets and Excel have hard limits at 1-5 million rows, but get slow long before that
Reusable code (packages)
Automation
Side-by-side1
| Task | Spreadsheets | Programming Languages |
|---|---|---|
| Loading data | Easy | Medium |
| Viewing data | Easy | Medium |
| Filtering data | Easy | Medium |
| Manipulating data | Medium | Medium |
| Joining data | Hard | Medium |
| Complicated transforms | Impossible2 | Medium |
| Automation | Impossible2 | Medium |
| Making reusable | Limited3 | Medium |
| Large datasets | Impossible | Hard |
These ratings are obviously subjective
Not including scripting or external tools
See Google Sheets named functions and Excel LAMBDA functions
Spreadsheet scripting/automation
Python vs. other languages
Good for general-purpose and data stuff
Widely used in both industry and academia
Relatively easy to learn
Open source
Where to Python
Pyton can be run in:
A text file, using the
pythoncommandAn integrated development environment (IDE), such as:
Various other tools are built around them
What we’ll be using for this class
Each can be on your computer (“local”), or in the cloud somewhere. All call python under the hood, more or less.
Pandas
A Python package (bundled up code that you can reuse)
Very common for data science in Python
Both organize around “data frames”
Jupyter
Alternative programming environment
Supports Python by default, and other languages with added kernels
Nicely displays output of your code so you can check and share the results
Avoids using the command line
Command line vs. Jupyter
Portfolio site folder setup
[one-time]
Create a folder (on your computer) called [username].github.io.
Example:
afeld.github.ioDo so outside of your
computing-in-context/(or equivalent) folder.This is preparing us to make a “user site” on GitHub Pages.
If you already have one, use a
computing-in-context/folder (new or existing) to make a “project site”.
Folder structure
You’ll have two parent/top-level/working folders:
| Folder | Contains | Git repository* | GitHub repository* | GitHub Pages site* |
|---|---|---|---|---|
[username].github.io/ | Projects; sharable work from other classes | ✅ | ✅, public | ✅ |
computing-in-context/ (or equivalent) | Labs, etc. | Optional | Optional, private only | ❌ |
*We haven’t done this yet.
For this course, we’ll refer to these as “working folders”.
In Python development, each working folder will generally:
Contain multiple (related) files, potentially under sub-folders
Manage its own dependencies, via its own:
requirements.txtVirtual environment
Have its own version control
Be a Git repository (it’ll contain
.git/)Have a corresponding repository on GitHub (or equivalent)
Have a
.gitignore
You’ll open each as a workspace in VSCode, depending on what you’re working on.
Like the Python setup, this is the recommended+supported structure. You can do something else, but you’re on your own.
Create the virtual environment
[once per working folder]
In the terminal, create a virtual environment.
python -m venv .venv
Install initial packages
ipykernel
pandas
plotly

# needed for plotly
nbformat
statsmodels
Jupyter, continued
Walk through the Jupyter interface.
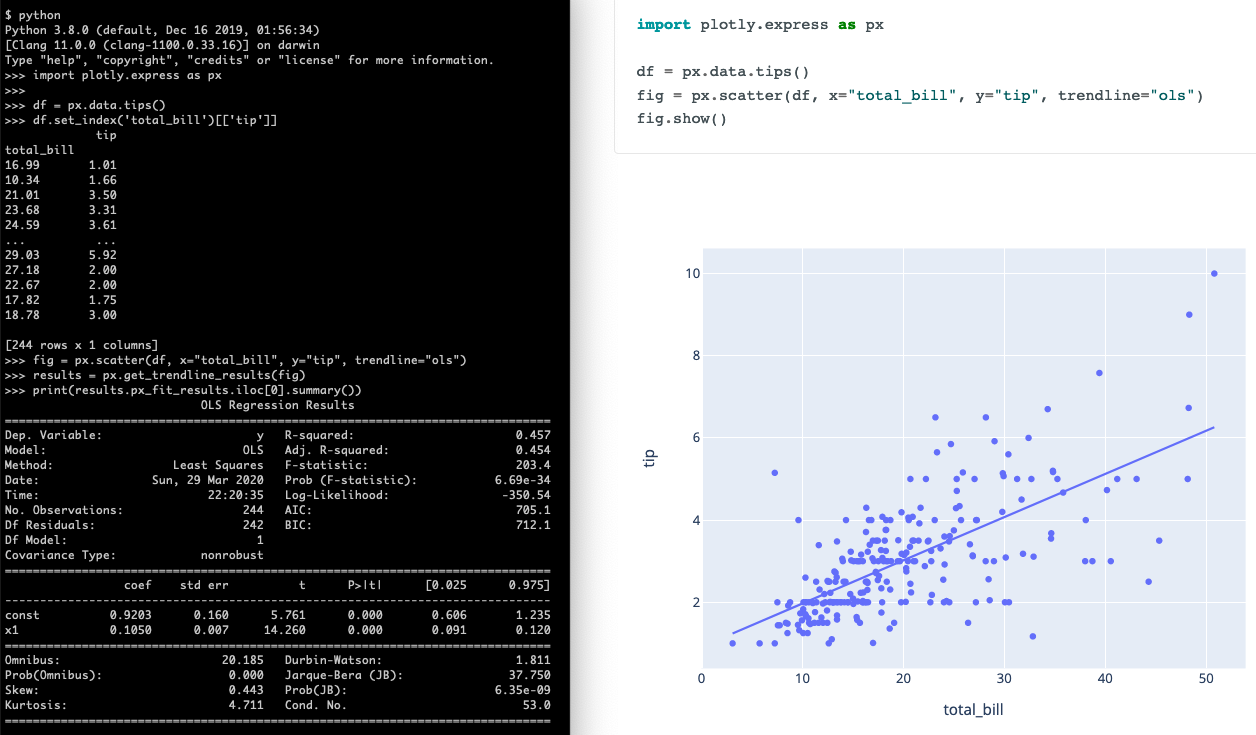
Copy in this example.
Select the kernel. [once per notebook]
Click
Install suggested extensions, if it asks. [once per computer]Click
Python Environments….Select the
pythonunder the virtual environment.Mac:
.venv/bin/pythonWindows:
.venv\Scripts\python.exe
Using multiple cells
Show each step in their own cell:
Data loading
Displaying the
dfCreating the chart
FYI px.data.tips() loads one of Plotly’s sample datasets. That’s not needed when plotting other datasets.
We’ll learn more about pandas and plotly soon.
Jupyter basics
A “cell” can be either code or Markdown (text). Raw Markdown looks like this:
## A heading

Plain text

[A link](https://somewhere.com)
Running
You “run” a cell by either:
Pressing the ▶️ button
Pressing
Control+Enteron your keyboard
Cells don’t run unless you tell them to, in the order you do so
Generally, you want to do so from the top every time you open a notebook
Output
The last thing in a code cell is what gets displayed when it’s run
The output gets saved as part of the notebook
Just because there’s existing output from a cell, doesn’t mean that cell has been run during this session
Hosted notebooks
Jupyter can run on on your computer (“local”), or in the cloud somewhere. Many options.
Some best practices
Make variable names descriptive
Only do one thing per line
Makes troubleshooting easier
Make notebooks idempotent
Makes your work reproducible
Use
RestartthenRun allbuttons in toolbar